 how-to
Ensuring Batch Consistency for Research: A Lab Guide
Table of Contents
- Why Batch Consistency Decides Whether Your Research Holds Up
- Step 1: Plan Experimental Design Around Batch Variables
- Step 2: Set Standard Protocols and Documented Procedures
- Step 3: Peptide Purity Testing and Analytical Verification
- Step 4: Peptide Identity Verification Before You Run Assays
- Step 5: Read the Certificate of Analysis for Peptides Properly
- Step 6: Peptide Storage and Handling That Protect Repeatability
- Step 7: Separate Batch Effects From Other Experimental Variation
- Frequently Asked Questions
Last Updated: October 21, 2026
Why Batch Consistency Decides Whether Your Research Holds Up
Batch consistency is the degree to which separate production lots of the same material perform identically in your assays, the difference between a publishable result and one you have to explain away.
Your design can be flawless and your statistics airtight, yet your conclusions still collapse if lot two of a peptide behaves differently from lot one.
Below is a seven-step workflow that turns batch consistency into a documented process: planning, protocols, purity testing, identity verification, Certificates of Analysis, storage, and separating true batch effects from noise.
Step 1: Plan Experimental Design Around Batch Variables
Name every source of variability before you touch a pipette; designs that ignore batch variables produce indefensible data.
A common mistake is treating all vials of a compound as interchangeable. Each lot carries its own history: synthesis, purification, lyophilization, shipping. Decide up front which variables you control and which you document.
Build the batch variable into the design
Write a design brief before ordering material, answering four questions:
- Single-lot vs. multi-lot design. If your conclusion depends on a treatment effect, run a pilot comparing two lots before committing to a full study. If the pilot shows a lot difference larger than your expected effect, the study is underpowered regardless of n.
- Randomization. Assign samples to plates, positions, and days randomly so a batch effect cannot masquerade as a treatment effect. Randomize at the level of the experimental unit, not the pipette tip.
- Blocking. Group experimental units by lot and by day, then analyze within blocks. Blocking converts nuisance variation into a term you can estimate and remove.
Set acceptance criteria before you run
A design is only as strong as the thresholds you commit to in advance. Write these into the plan:
- Maximum acceptable between-lot difference. Define it in the units of your primary readout (for example, a mean difference no larger than the assay's own day-to-day standard deviation).
- Coefficient of variation (CV) target. For a lot-bridging check, a common working target is a between-lot CV at or below the within-lot CV observed in your validation runs. If between-lot CV exceeds within-lot CV by a wide margin, treat the lots as non-equivalent until proven otherwise.
- Minimum detectable effect. Calculate it from your pilot variance so you know whether the study can detect the effect you care about.
A practical lot-bridging calculation
Suppose your assay's within-lot CV from validation is 4%. Run three independent preparations of the old lot and three of the new lot on the same plate, then compute each lot's mean, standard deviation, and CV.
Document the plan in your lab notebook and reference it in your methods section. Reviewers increasingly ask how material variability was controlled; a written plan with pre-specified thresholds answers that before it is asked.
Step 2: Set Standard Protocols and Documented Procedures
Standard protocols are the written rules that make every operator, on every day, do the same thing the same way. Without them, batch consistency is luck.
The research process breaks down when procedures live in someone's head. Write them down, version them, and train against them. A protocol template should capture:
- Reagent preparation, including diluent and concentration
- Equipment settings and calibration dates
- Timing tolerances for each step
Version control matters more than most labs admit. When a protocol changes, note what changed and why.
Standardized procedures also protect you during audits and peer review. If two technicians can read the same protocol and produce the same result, you have built repeatability into the process.
Step 3: Peptide Purity Testing and Analytical Verification
Peptide purity testing measures how much of your sample is the target compound versus impurities and related substances, the first hard number that tells you whether two lots are comparable.
Third-party analytical testing gives you an independent read; in-house checks are useful, but an external lab removes the temptation to grade your own homework.
What to look for in purity data:
- A stated method, not just a number. HPLC with a defined column and gradient is verifiable.
- A chromatogram, so you can see the impurity profile, not only the headline percentage.
- Consistency across lots. Two lots at the same purity but with different impurity profiles are not interchangeable.
Set your own acceptance criteria before you buy.
Step 4: Peptide Identity Verification Before You Run Assays
Peptide identity verification confirms that the material in the vial is actually the compound on the label.
A sample can be 99% pure and still be the wrong peptide.
Before you run assays, confirm:
- Molecular weight matches the expected value within tolerance.
- Sequence or composition matches the specification.
- Counter-ion and salt form are documented, since these affect how you weigh and dissolve the material.
This step catches labeling errors and mix-ups before they contaminate a dataset.
At Amoravia, every standard catalog compound ships with third-party testing and a detailed Certificate of Analysis, so identity and purity are documented before the material reaches your bench.
Step 5: Read the Certificate of Analysis for Peptides Properly
A Certificate of Analysis for peptides is the supplier's formal record of testing: what was measured, how, and with what result.
Most labs glance at the purity figure and move on. That is where problems hide. A complete CoA should tell you:
- The test methods used (HPLC, MS, and any others)
- The results for each test, with values and units
- The lot number that ties the document to your specific vial
Ask three questions: does the lot number match my vial? Do the methods match the claims?
If a CoA is vague, incomplete, or missing a lot number, treat that as a red flag. Documented test results are the backbone of research transparency.
Step 6: Peptide Storage and Handling That Protect Repeatability
Peptide storage and handling determine whether the material you verified on arrival is still the same material when you use it.
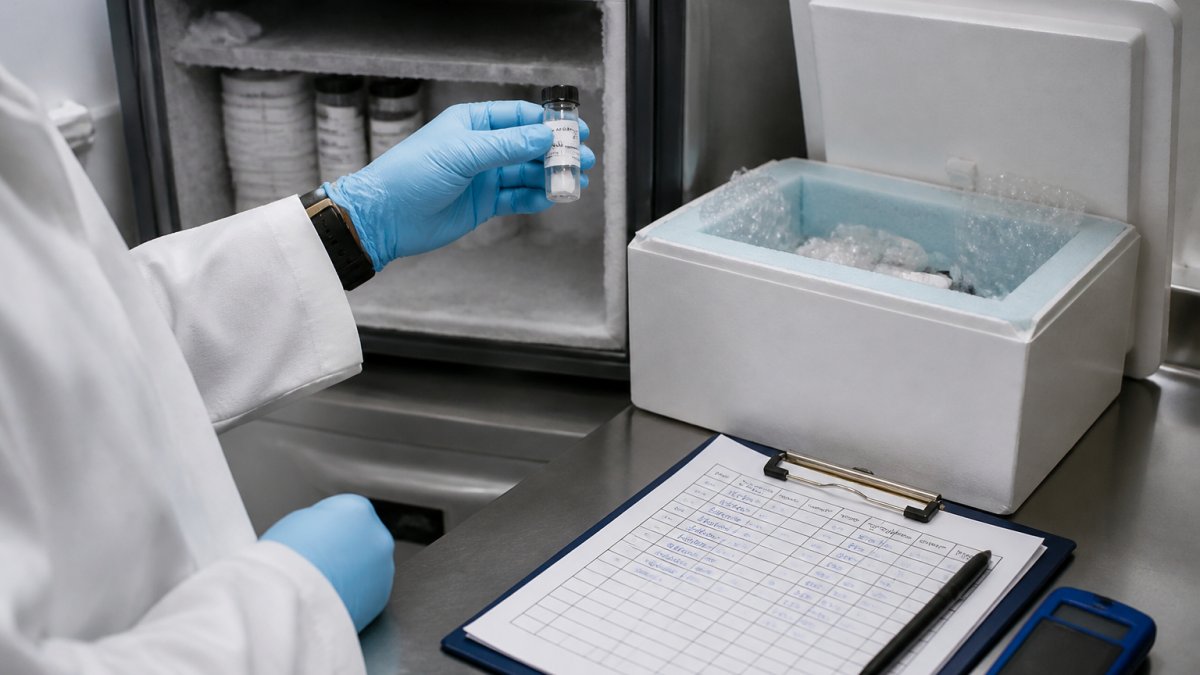
Lyophilized peptides are generally more stable than reconstituted solutions, but both demand discipline. Storage conditions and stability are part of batch consistency, not separate from it.
Practical handling rules:
- Store lyophilized vials cold and dry, per the supplier's instructions, and log freezer temperatures.
- Reconstitute in small aliquots and avoid repeated freeze-thaw cycles.
- Use the recommended diluent, since the wrong buffer can cause aggregation or precipitation.
Cold-chain shipping matters too. If material arrives warm or thawed, the CoA describes a lot that no longer exists in your freezer.
Step 7: Separate Batch Effects From Other Experimental Variation
A batch effect is a shift in results caused by the lot itself, not by your treatment. The hard part is proving a shift is a batch effect and not day-to-day noise.
When results drift, resist the urge to blame the peptide. Variation has many sources: operator, instrument, reagent age, temperature, plate position. Isolating the batch effect means ruling the others out in a fixed order, not guessing.
A troubleshooting decision tree
Work through these gates in sequence. Stop at the first gate that explains the shift.
- Is the shift repeatable? Rerun the same sample on a fresh plate. If the shift disappears, you have a plate or reagent problem, not a batch problem.
- Does it follow the lot? Run old and new lots side by side in the same session on the same plate. If the shift follows the lot, you have a candidate batch effect. If it follows the day, operator, or instrument, you do not.
- Does it survive a fresh reconstitution? Reconstitute a new vial from each lot and repeat the side-by-side. If the shift disappears, the cause is handling or storage of the previous vial, not the lot.
- Does it survive an independent method? Confirm with a second analytical method (for example, a different HPLC gradient or an orthogonal assay). If only one method sees the shift, suspect the method, not the material.
- Is the impurity profile different? Compare chromatograms, not just purity percentages. Two lots at the same purity with different impurity profiles can behave differently in a biological assay.
- Is the difference larger than your pre-specified threshold? Apply the acceptance criteria from your design brief. If the between-lot difference is smaller than the assay's day-to-day standard deviation, you likely have noise, not a batch effect.
Use control charts to separate signal from noise
A control chart plots a known reference sample over time with a center line and upper and lower control limits, typically set at the mean plus or minus three standard deviations from a stable baseline period. Rules of thumb most practitioners use:
- One point outside a control limit signals a special cause worth investigating.
- A run of seven or more points on one side of the center line signals a shift, even if no single point is out of limits.
- A trend of consecutive points moving in one direction signals drift, often from reagent aging or instrument calibration.
Apply the chart to a reference material you run every session. When the new lot enters, the chart tells you whether the shift is larger than the normal variation you have already characterized.
Compare variance components
A simple variance decomposition helps you decide where to act. Estimate:
- Within-batch variance from replicate preparations of the same lot.
- Between-batch variance from multiple lots measured in the same session.
- Between-day variance from the same lot measured across days.
If between-batch variance is small relative to within-batch variance, you likely have a noise problem, not a lot problem. If between-batch variance is large and repeatable, you have a genuine batch effect worth investigating with the supplier. Report the ratio, not just the raw numbers, so reviewers can see the comparison.
Match the cause to the fix
| Symptom | Most likely cause | First action |
|---|---|---|
| Shift follows the lot in same-session comparison | True batch effect | Bridging study with pre-specified criteria, then contact supplier |
| Shift follows the day or operator | Day or operator variation | Randomize and block by day; retrain and re-check |
| Shift appears only after reconstitution | Storage or handling | Compare fresh vial, review freeze-thaw log and diluent |
| Shift appears on one instrument only | Equipment or calibration | Calibrate, run a reference standard, cross-check on a second instrument |
| Purity matches but assay differs | Impurity profile or counter-ion form | Compare chromatograms and salt-form documentation |
| Gradual drift over weeks | Reagent aging or temperature | Replace reagents, review freezer logs, re-baseline the control chart |
Frequently Asked Questions
What does batch-to-batch consistency mean in research?
Batch-to-batch consistency means that separate production runs of the same compound perform the same way in your assays. In practice it covers identity, purity, and physical behavior: the peptide is the same molecule, the purity meets the stated specification, and it dissolves and behaves the same way in your buffer. For research-grade peptides, a supplier working to a minimum purity threshold of 99% or higher and testing every batch gives you the baseline needed to compare runs. Consistency is not a single number; it is a documented pattern across purity, identity, and storage history.
How can researchers verify consistency between peptide batches?
Compare analytical data across batches rather than trusting a single certificate. Run peptide purity testing by HPLC on the new batch and compare the chromatogram profile, not just the headline percentage. Check peptide identity verification results such as mass spectrometry against the expected molecular weight. Then run a small pilot assay with the new batch alongside a retained sample of the old one under identical conditions. If the pilot results fall within your predefined acceptance criteria, release the batch for full experiments. Keep the comparison records so the check is repeatable.
What should a Certificate of Analysis for peptides include?
A useful Certificate of Analysis for peptides names the compound, lot number, and test date, then reports purity by HPLC with the method used, identity confirmation by mass spectrometry, and appearance of the lyophilized powder. Inquire whether endotoxin, heavy metals, and residual solvents are tested and reported, as not every supplier includes them by default. The document should come from a third-party laboratory or clearly state who performed the testing. If a certificate lists results without methods or lot-specific data, treat it as marketing rather than verification. Request a real example before ordering.
How can storage and handling affect peptide consistency?
Lyophilized peptides are stable when kept cold and dry, but warmth, moisture, and repeated freeze-thaw cycles degrade them. Store vials at the temperature stated on the label, let them equilibrate to room temperature before opening to prevent condensation, and reconstitute in aliquots rather than one large vial. Record storage conditions and reconstitution dates. Peptide storage and handling errors often look like batch-to-batch variability: the compound changed, but the cause was the shelf, not the synthesis. Cold-chain shipping under controlled conditions protects the batch before it reaches your freezer.